Mortgage Reality
Loan Reality

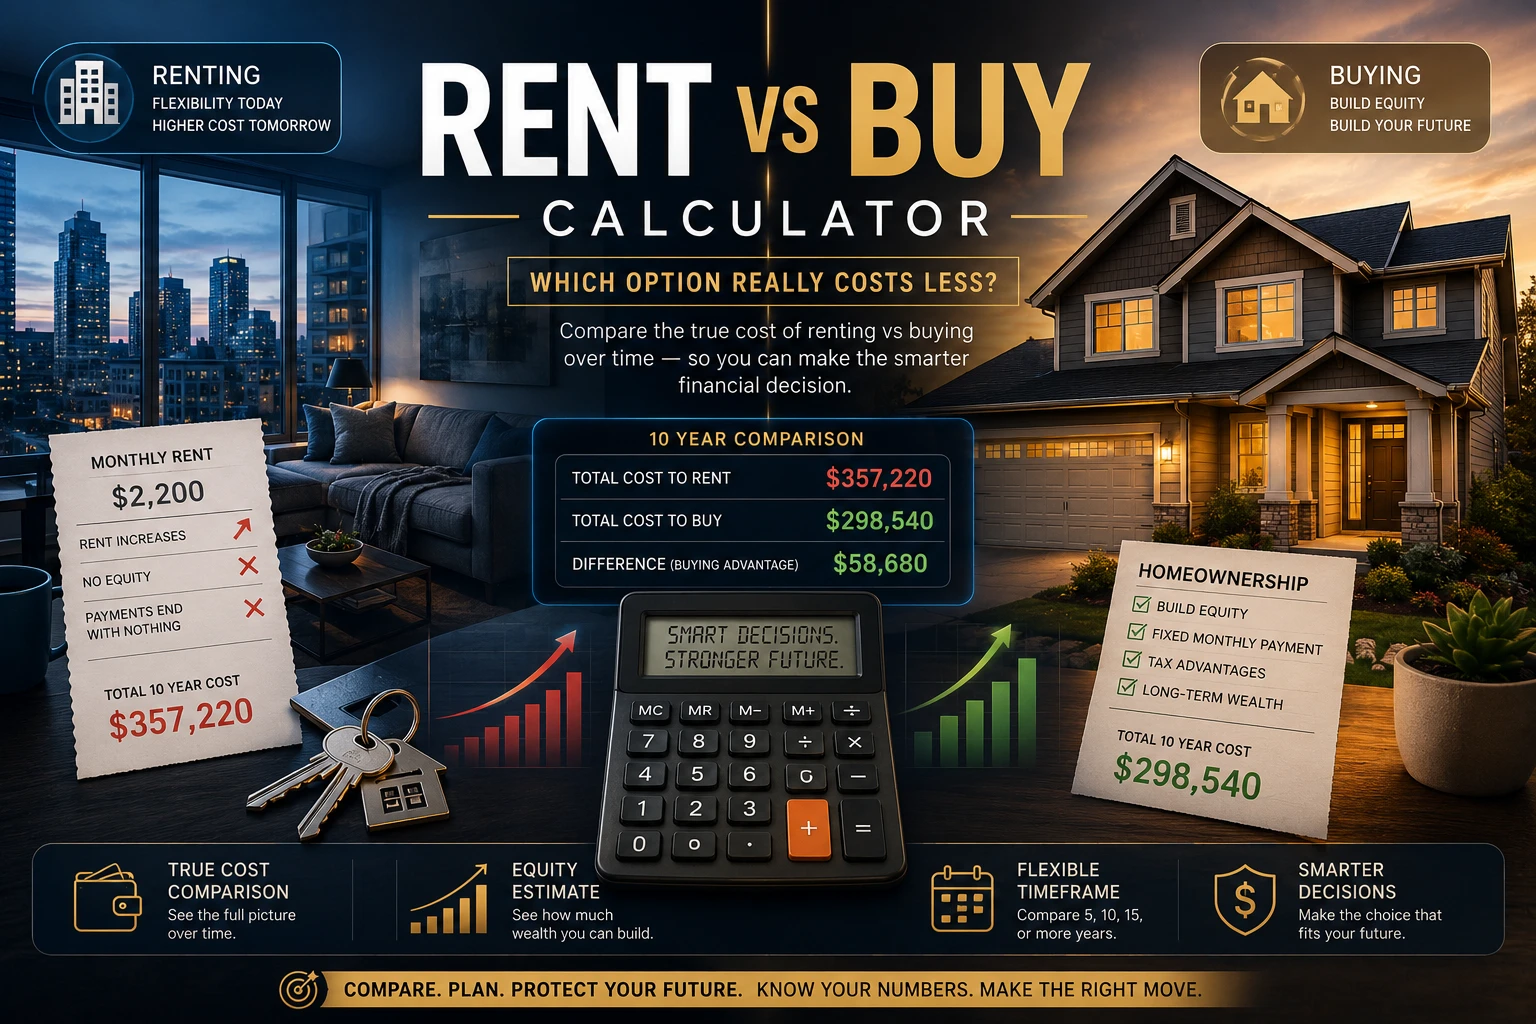
Rent vs Buy Calculator — Which Choice Costs Less Over Time?

Compare what you spend, what you keep, what you build, and where renting or buying may become financially favorable over time.

Renting has a cost.

Buying has a cost.

But comparing them by looking only at:

Monthly rent

versus:

Monthly mortgage payment

can give you the wrong answer.

Buying may require:

A down payment

Closing costs

Mortgage interest

Property taxes

Homeowners insurance

HOA dues

Mortgage insurance

Maintenance

and eventually:

Selling costs.

Renting may avoid many of those expenses.

But rent can also rise over time, while a homeowner may build equity as the mortgage balance falls and the home’s value changes.

That’s why the QuickLoanCalc Rent vs. Buy Calculator is built around a better question:

“After the number of years I actually expect to stay, which choice leaves me financially better off?”

Use the calculator to compare:

Rent paid over time

Future rent increases

Homeownership costs

Mortgage interest

Principal repaid

Estimated home appreciation or decline

Purchase closing costs

Selling costs

Estimated net home equity

Rent-vs-buy break-even time

and even:

What may happen if the lower-cost option invests the difference.

Because:

Rent vs. buy is not just a monthly-payment question.

It’s a time-horizon question.


Compare Renting vs. Buying

QuickLoanCalc Rent vs. Buy Calculator

Rent vs. Buy Is Really a Time-Horizon Question

Compare what you spend, what you keep, what you build, and where the financial advantage may change over the number of years that actually matter to you.

1. Currency & Time Horizon

Currency selection changes display formatting only. It does not convert values.

2. Renting
$
%
$
3. Buying — Property & Mortgage
$
$
%
%
4. Buying — Ongoing Housing Costs

Taxes, insurance and maintenance can be entered as annual dollars or as a percentage of today's home value. Their optional growth rates are modeled separately.

$
%
$
%
$
%
$
0 means include the entered PMI for the entire comparison period. QuickLoanCalc does not assume when mortgage insurance ends.
%
%
5. Home Value & Transaction Costs
%
%
%
6. Optional Wealth Comparison

This optional model asks what happens if the side with lower upfront or monthly housing costs invests the difference instead of spending it.

%
This is only a scenario assumption. It is not an investment forecast or recommendation.
Estimated financial advantage at the end of your comparison period
Buying is ahead by $0
Based on estimated housing cash flows and net sale equity after selling costs.
Break-even point
Initial monthly rent cost
$0
Initial monthly ownership cost
$0
Total renting cash cost
$0
Buying net cost after estimated sale
$0
Estimated net home equity
$0
The winner can change over time.
A higher initial ownership cost can still produce a lower net cost later if equity and home value offset enough of the owner's unrecoverable costs.
Renting Breakdown 10-year comparison
Total rent paid$0
Total renters insurance$0
Estimated monthly rent at end$0
Total renting cash cost$0
Buying Breakdown Cash spent, debt reduced & equity remaining
Down payment$0
Purchase closing costs$0
Mortgage P&I paid$0
Mortgage interest paid$0
Principal repaid$0
Property taxes$0
Homeowners insurance$0
HOA / association$0
PMI / mortgage insurance$0
Maintenance$0
Estimated future home value$0
Mortgage balance at end$0
Estimated selling costs$0
Estimated net home equity$0
Buying net cost after estimated sale$0
Where Did the Home Equity Come From? Illustrative components
Original down payment$0
Principal repaid$0
Home value change$0
Less estimated selling costs$0
Estimated net equity$0
Optional Wealth Comparison Assuming a 5% annual return
Renter investment balance$0
Homeowner investment balance$0
Homeowner net home equity$0
Estimated wealth advantage
What Makes the Result Flip? Break-even assumptions at the selected horizon
Break-even annual home appreciation
Break-even annual rent increase
Year Rent net cost Buy net cost* Who is ahead?
How the comparison works: renting cost is cumulative rent plus renters insurance. Buying net cost starts with the down payment and purchase closing costs, adds mortgage payments and entered ownership expenses, then subtracts estimated net sale proceeds at the selected point in time. Net sale proceeds are estimated home value minus remaining mortgage balance and estimated selling costs.
Important: This is an educational scenario model, not a prediction or financial recommendation. Home appreciation, rent growth, taxes, insurance, maintenance, HOA costs, investment returns and selling costs can differ materially from the assumptions entered. The calculator does not automatically include tax deductions, capital-gains tax, rent deposits, utilities, financing fees beyond the entered purchase closing costs, major renovations, special assessments, moving costs, opportunity costs other than the optional investment model, or loan-specific mortgage-insurance rules. Verify actual costs and loan terms before making a housing decision.

Start with the number of years you realistically expect to remain in the home or rental.

Then enter your renting assumptions:

Monthly rent

Annual rent increase

and:

Renters insurance.

For buying, enter:

Home price

Down payment

Mortgage rate

Mortgage term

Property taxes

Homeowners insurance

HOA dues

Mortgage insurance

Maintenance

Expected home-value change

Purchase closing costs

and:

Estimated selling costs.

Then change the assumptions.

Try:

3 years.

7 years.

10 years.

15 years.

The answer may change dramatically.


Rent vs. Buy Is Really a Time-Horizon Question

Imagine you’re deciding between:

Renting

$2,200 per month

and:

Buying

A $400,000 home.

Someone might look at the mortgage payment and immediately declare:

“Buying is better.”

Or:

“Renting is cheaper.”

Neither conclusion is necessarily correct.

If you stay only:

2 years,

buying costs such as the down payment, closing costs, mortgage interest, maintenance, and selling expenses may outweigh the equity you build.

If you stay:

12 years,

the result may look completely different.

The longer ownership period gives:

  • More time to repay principal
  • More time for rent to increase
  • More time for home value to change
  • More time for transaction costs to be spread across the ownership period

That’s why the first input in the upgraded calculator is:

Years to Compare.


Monthly Rent vs. Monthly Mortgage Is Not a Fair Comparison

Suppose:

Rent

$2,200/month.

And:

Mortgage P&I

$2,275/month.

At first glance:

Renting appears $75 cheaper.

But the homeowner may also pay:

Property Taxes

$500/month

Insurance

$200/month

Maintenance

$333/month

Now the initial ownership cost may be closer to:

$3,308/month.

That is:

More than $1,100 above the rent.

But that’s still not the entire comparison.

Part of the mortgage payment reduces:

Principal.

And the homeowner may eventually own:

Equity.

So we can’t simply compare:

$2,200 rent

with:

$3,308 ownership cost

and stop there either.

The real comparison requires:

Cash spent + debt remaining + asset value.


Renting Costs Money

This should be obvious.

Rent is money paid for:

The use of a home.

If you pay:

$2,200 per month,

that’s:

$26,400 during the first year.

If rent rises:

3% per year,

the monthly rent may eventually become substantially higher.

The QuickLoanCalc calculator estimates:

Total rent paid

Renters insurance

Ending monthly rent

and:

Total renting cash cost.


But Rent Is Not “Throwing Money Away”

That phrase oversimplifies the decision.

Rent can purchase:

  • Housing
  • Flexibility
  • Reduced maintenance responsibility
  • Lower upfront cash requirements
  • Easier relocation
  • Reduced exposure to property-value changes

A renter may also keep money that a buyer would have used for:

Down payment and closing costs.

Whether the renter:

Saves it

Invests it

or:

Spends it

is another question.

That’s why the upgraded calculator includes an optional:

Wealth Comparison.


Buying Costs Money Too

Homeownership can build equity.

But not every dollar a homeowner spends becomes equity.

Some ownership costs are:

Consumed.

These can include:

  • Mortgage interest
  • Property taxes
  • Homeowners insurance
  • HOA dues
  • Mortgage insurance
  • Maintenance
  • Purchase closing costs
  • Selling expenses

So saying:

“Rent is wasted money but a mortgage isn’t”

misses an important distinction.

A mortgage payment generally contains:

Principal

which reduces the loan balance,

and:

Interest

which is the cost of borrowing.

Only the principal reduction directly increases ownership equity through debt repayment.


Example: Buying a $400,000 Home

Suppose:

Purchase Price

$400,000

Down Payment

10%

or:

$40,000.

Estimated mortgage:

$360,000.

At:

6.50%

for:

30 years,

monthly principal and interest is approximately:

$2,275.

Now add:

Property Taxes

$6,000/year

or:

$500/month.

Homeowners Insurance

$2,400/year

or:

$200/month.

Maintenance

1% of home value per year

or initially:

About $333/month.

Before HOA or mortgage insurance:

Estimated first-year ownership cost is already around:

$3,308/month.

Compare that with:

$2,225/month

for $2,200 rent plus $25 renters insurance.

Initially:

Renting may cost substantially less per month.

But now we need to look at:

What happens over time.


Down Payment Is Part of the Rent-vs-Buy Decision

Suppose a buyer puts:

$40,000 down.

That money becomes part of the homeowner’s initial equity.

But the renter doesn’t have to make that down payment.

So a fair comparison should acknowledge:

The renter may still have that $40,000.

And buying may also require:

Purchase closing costs.

If closing expenses are:

$12,000,

the renter may initially retain:

$52,000

that the buyer committed to the transaction.

What happens to that money matters.

That’s why the calculator includes an optional investment model.


Your Down Payment Is Not Your Entire Buying Cost

Suppose:

Home price:

$400,000.

Down payment:

$40,000.

You may think:

“Buying costs me $40,000 upfront.”

But then add:

Purchase Closing Costs

Perhaps:

$12,000.

Now upfront commitment becomes:

$52,000.

That’s before:

  • Moving
  • Repairs
  • Furniture
  • Renovations
  • Other personal expenses

For a detailed closing estimate, use:

➡️ Closing Cost Calculator


Home Appreciation Can Completely Change the Result

Suppose the home costs:

$400,000.

If home value stays exactly flat for 10 years:

$400,000 remains $400,000.

If it grows at:

3% annually,

after 10 years the estimated value becomes approximately:

$537,566.

That’s an increase of:

About $137,566.

That appreciation can become a major part of homeowner equity.

But:

Appreciation is not guaranteed.

Home values can:

Rise

Remain flat

or:

Fall.

That’s why the calculator allows:

Positive, zero, or negative home-value change.

QuickLoanCalc should not assume:

“Homes always go up.”


What If the Home Doesn’t Appreciate?

This is one of the most important scenarios to run.

Set:

Home Appreciation = 0%.

Then calculate again.

Does buying still win?

Maybe.

Maybe not.

Then try:

−2%.

If the answer changes dramatically:

Your result depends heavily on appreciation.

That’s useful to know before deciding.


Selling the Home Costs Money Too

Suppose after 10 years your home is worth:

$537,566.

And your remaining mortgage is:

$271,000.

You might calculate:

$537,566 − $271,000 =

$266,566 of equity.

But that assumes:

Selling costs nothing.

Real-world sales can involve:

  • Agent compensation
  • Seller closing costs
  • Repairs
  • Concessions
  • Transfer-related costs
  • Other expenses

Suppose estimated selling expenses equal:

$32,000.

Estimated net equity becomes closer to:

$234,000.

That’s why the upgraded calculator shows:

Net Equity After Estimated Selling Costs.


Gross Equity and Net Equity Are Different

Suppose:

Estimated Home Value

$537,566

Remaining Mortgage

$271,000

Gross equity:

$266,566.

Now subtract:

Estimated Selling Costs

$32,000.

Net equity:

$234,566.

If you’re comparing renting against selling the home at the end of the selected period:

Net equity is the more useful number.


Where Did the Home Equity Come From?

The upgraded QuickLoanCalc calculator breaks equity into pieces.

Suppose:

Original Down Payment

$40,000

Principal Repaid

$49,000

Home Appreciation

$137,000

Combined:

$226,000.

Then subtract estimated selling costs.

Now you can see:

What actually created the equity.

This is important because:

Equity doesn’t come from one place.

It can come from:

Cash invested upfront

Mortgage principal repayment

and:

Changes in the home’s value.


Mortgage Interest Is a Homeownership Cost

Suppose during the selected period you pay:

$200,000

toward the mortgage.

That does not mean:

You built $200,000 of equity.

Part went toward:

Principal.

Part went toward:

Interest.

The calculator separates:

Mortgage P&I Paid

Mortgage Interest Paid

and:

Principal Repaid.

That makes the ownership side much easier to understand.


Property Taxes Don’t Become Equity

Suppose property taxes total:

$75,000

during your ownership period.

That money was part of:

The cost of owning the property.

It did not reduce the mortgage balance.

It does not become:

Home equity.

The same general principle applies to:

  • Insurance
  • HOA
  • Maintenance
  • Mortgage insurance

Those expenses can be necessary parts of ownership without becoming an asset.


Maintenance Belongs in the Comparison

A renter may call the property owner when:

  • Air conditioning fails
  • Plumbing leaks
  • Roof problems appear
  • Appliances fail

A homeowner may be responsible for those expenses.

That’s why the calculator allows maintenance to be entered as:

Annual Dollar Amount

or:

Percentage of Home Value.

It also allows:

Maintenance cost growth.

There is no universal percentage that every house will require.

Use a reasonable assumption for the property you’re considering.


Taxes and Insurance Can Rise Too

Rent isn’t the only housing expense that can increase.

A homeowner’s:

Property taxes

Insurance

HOA dues

and:

Maintenance costs

can also change over time.

So if your rent assumption grows:

3% annually,

but every homeownership expense stays frozen for:

15 years,

you may be unintentionally making buying look better.

The updated calculator lets you independently model:

Tax growth

Insurance growth

HOA growth

and:

Maintenance growth.


Mortgage Insurance Can Affect the Comparison

Depending on the loan, the buyer may have:

PMI or other mortgage insurance.

QuickLoanCalc lets you enter:

Monthly Mortgage Insurance

and optionally:

How many months to include it.

We deliberately do not automatically determine when mortgage insurance ends.

Rules can vary by:

  • Loan type
  • Lender
  • Loan-to-value
  • Mortgage program
  • Other circumstances

Use a lender estimate whenever possible.


The Break-Even Point May Be the Most Important Result

Imagine:

Year 1

Renting is ahead by:

$24,000.

Year 3

Renting is ahead by:

$12,000.

Year 5

Renting is ahead by:

$3,000.

Year 6

Buying moves ahead by:

$2,000.

The meaningful result is:

Buying breaks even around Year 6.

That tells you something much more useful than:

“Buying is cheaper after 10 years.”

Because now you can compare the break-even point with:

How long you actually expect to stay.


If You’re Moving in Three Years, a Ten-Year Win May Not Matter

Suppose buying becomes financially favorable after:

7 years.

But you expect to relocate in:

3 years.

Then the 10-year result may have little relevance to your actual situation.

That’s why:

Time horizon comes first.

A rent-vs-buy calculator should answer:

Your timeline.

Not an arbitrary 30-year assumption.


What If You Stay 15 Years?

Now reverse the example.

Perhaps renting wins for:

The first 5 years.

Buying breaks even around:

Year 7.

And by:

Year 15,

ownership is ahead substantially.

For someone planning to remain in the home:

Long term,

that’s valuable information.

Same property.

Same rent.

Same mortgage.

Different:

Time horizon.

Different answer.


Watch the Comparison Change Year by Year

The upgraded calculator provides a:

Year-by-Year Comparison.

For each year, it estimates:

Rent Net Cost

Buy Net Cost

and:

Which Side Is Ahead.

This allows you to see:

The crossover instead of only the final result.

That’s one of the strongest ways to understand rent vs. buy.


Buying Net Cost Is Not the Same as Buying Cash Spent

This distinction matters.

Suppose the homeowner spends:

$400,000

in total cash over the period.

But ends with:

$220,000 of net equity.

The economic cost isn’t simply:

$400,000.

If the property were sold under the calculator’s assumptions, some of that cash is represented by:

Remaining equity.

So the calculator estimates:

Buying Net Cost After Estimated Sale.

That’s different from:

Total homeowner cash outflow.

Both numbers matter.


Renting Cash Cost Is Simpler

If a renter pays:

$300,000

in rent and renters insurance over the period:

That’s approximately $300,000 of housing cash cost.

The renter does not own the rental property afterward.

But again:

That doesn’t automatically make renting inferior.

The renter may have avoided:

  • Down payment
  • Closing costs
  • Maintenance
  • Selling expenses
  • Home-price risk

The entire comparison matters.


What If the Renter Invests the Down Payment?

Suppose the buyer commits:

$52,000

between:

Down payment

and:

Purchase closing costs.

The renter keeps that money.

If the renter invests it and earns a return:

That creates another financial asset.

The upgraded calculator includes an optional:

Estimated Investment Return.

This allows a more complete comparison between:

Renter Investment Balance

and:

Homeowner Net Equity.


What If Renting Costs Less Each Month?

Suppose:

Rent + Renters Insurance

$2,225/month.

Initial Ownership Cost

$3,300/month.

Difference:

$1,075/month.

If the renter actually invests:

$1,075 every month,

that can become substantial over time.

The optional wealth model estimates the effect.

But the key word is:

Optional.

If the renter simply spends the difference:

The investment balance never materializes in real life.


What If Buying Later Becomes Cheaper Each Month?

Now suppose rent rises over time.

Eventually:

Rent

$3,500/month.

Ownership Cash Cost

$3,100/month.

Now the homeowner has:

$400/month of lower housing expense.

The upgraded wealth comparison can model the homeowner investing that difference instead.

This keeps the investment comparison:

Symmetrical.


Investment Returns Are Not Guaranteed

If you enter:

5%

as the alternative investment return:

QuickLoanCalc is not predicting:

You will earn 5%.

The field is simply:

A scenario assumption.

Investments can:

  • Gain value
  • Lose value
  • Be volatile
  • Generate taxes or fees
  • Perform differently from expectations

Use the field to test assumptions.

Not to predict an outcome.


What Makes the Result Flip?

This may be one of the most distinctive results in the calculator.

Suppose your inputs say:

Buying wins.

That’s useful.

But a better question is:

How much would one assumption have to change before renting wins?

The calculator estimates:

Break-Even Home Appreciation Rate

and:

Break-Even Annual Rent Increase.

For example:

Rent and buy become approximately equal if home appreciation is 1.6% annually.

Now you know:

How dependent the answer is on appreciation.


A Strong Result and a Fragile Result Are Different

Suppose buying wins under:

−1% appreciation

0%

2%

4%

and:

6%.

That’s a relatively robust result under those scenarios.

But suppose buying only wins if:

Appreciation exceeds 4.8%.

That’s much more assumption-sensitive.

The calculator helps expose:

How strong the conclusion really is.


Stress-Test the Home Appreciation Assumption

Run:

Scenario 1 — No Appreciation

0%

Then:

Scenario 2 — Your Assumption

Perhaps:

3%

Then:

Scenario 3 — Home Value Declines

Maybe:

−2%

Then ask:

Does the winner change?

If it does:

Home-value assumptions are driving the result.


Stress-Test Rent Growth Too

Suppose you assume:

5% annual rent increases.

That can make ownership look increasingly attractive.

Now change rent growth to:

0%.

Does renting suddenly win?

If yes:

Rent inflation was a major part of your conclusion.

That’s useful information.


Don’t Build a Decision Around One Perfect Forecast

No one knows precisely what:

  • Rent will cost in 8 years
  • The home will be worth in 10 years
  • Insurance will cost
  • Taxes will become
  • Maintenance will require

So don’t treat one set of assumptions as:

A prophecy.

Treat them as:

A scenario.

Then run several.


Buying Can Win Without Massive Appreciation

It’s possible for buying to work even with modest home-value growth because:

Mortgage principal is being repaid.

Over time the owner can build equity through:

Debt reduction

even if home appreciation is limited.

But whether that outweighs:

  • Interest
  • Taxes
  • Insurance
  • Maintenance
  • Transaction costs

depends on the actual numbers.

That’s exactly what the calculator measures.


Appreciation Can Also Hide an Expensive Ownership Scenario

Suppose buying appears to win by:

$100,000.

But almost all of that advantage comes from assuming:

7% annual home appreciation.

Now set appreciation to:

2%.

Maybe buying loses.

That tells you:

Your conclusion depends heavily on a strong property-value forecast.

QuickLoanCalc should expose that.

Not hide it.


Rent Growth Can Do the Same Thing

Suppose the model assumes:

Rent rises 8% every year.

Eventually renting becomes extremely expensive.

That may make buying look unbeatable.

But if your actual rent growth is:

2%,

the result may be very different.

Use assumptions you can defend.


Rent vs. Buy Is Also About Flexibility

The calculator focuses on financial estimates.

But not every important factor fits into a formula.

Renting can offer:

  • Easier relocation
  • Fewer maintenance responsibilities
  • Less exposure to property values
  • Lower transaction friction

Buying can offer:

  • More control over the property
  • Potential equity growth
  • Housing stability
  • Ability to modify the home
  • Potentially more predictable mortgage P&I on a fixed-rate loan

Those are personal considerations.

The calculator handles:

The numbers.

You handle:

The life decision.


Can You Afford the Home Even If Buying Wins Long-Term?

Suppose the calculator says:

Buying wins after 9 years.

But the initial ownership cost is:

$1,200 more every month.

That could still be:

Too much for your present budget.

Long-term economics do not automatically create:

Short-term affordability.

Use:

➡️ Home Affordability Calculator

to examine whether the home fits income and expenses.


Check Your Debt-to-Income Ratio Too

A home may look good in a rent-vs-buy analysis.

But lenders may also consider:

Debt-to-income ratio.

Use:

➡️ Debt-to-Income Calculator

to compare recurring monthly debt against gross income and see how a proposed housing obligation may affect your DTI.


Calculate the Mortgage Separately

The Rent vs. Buy Calculator uses mortgage math as part of the comparison.

But if you’re seriously considering the property:

➡️ Mortgage Calculator

can give you a deeper look at:

  • Monthly P&I
  • Taxes
  • Insurance
  • PMI
  • HOA
  • Rate sensitivity
  • 15 vs. 30 years
  • Scheduled lifetime interest

The Rent vs. Buy Calculator answers:

Rent or own?

The Mortgage Calculator answers:

What does this mortgage actually cost?


Calculate the Cash Needed to Buy

Before deciding:

“Buying wins,”

make sure you understand how much cash buying may require.

Use:

➡️ Down Payment Calculator

for the down-payment side.

Then:

➡️ Closing Cost Calculator

for:

  • Lender fees
  • Prepaids
  • Escrow
  • Credits
  • Estimated cash still due

A financially attractive home purchase still has to be:

Fundable today.


What If You Plan to Pay the Mortgage Off Faster?

The rent-vs-buy comparison uses the mortgage assumptions you enter.

If you intend to make:

  • Extra monthly payments
  • Annual principal payments
  • Lump sums
  • One extra full payment each year

then the actual ownership path may differ.

Use:

➡️ Mortgage Payoff Calculator

to estimate how much time and interest early principal payments could eliminate.


What If You Refinance?

A future refinance could change:

  • Mortgage payment
  • Interest expense
  • Remaining term
  • Ownership cost

But refinancing can also involve:

New closing costs.

If you’re modeling a real refinance opportunity:

➡️ Refinance Calculator

can help compare the existing mortgage against the proposed new loan.


How Much of Your Life Does the Housing Cost Represent?

Suppose renting costs:

$300,000

over 10 years.

Or buying produces:

$200,000

of interest, taxes, insurance, and other non-equity costs.

Those numbers represent:

Work.

If your take-home income is:

$40/hour,

then:

$200,000 ÷ $40 =

5,000 hours.

That’s:

125 full 40-hour workweeks.

Use:

➡️ Loan Life Cost Calculator

to translate financing and debt costs into estimated work hours, workdays, and workweeks.


Frequently Asked Questions

Is renting cheaper than buying?

Sometimes.

The answer depends on:

  • Rent
  • Rent increases
  • Home price
  • Down payment
  • Mortgage rate
  • Ownership costs
  • Home-value changes
  • Transaction costs
  • How long you stay

That’s why there is no universal answer.


Is buying always better because you build equity?

No.

Homeowners may build equity through:

Down payment

Principal repayment

and:

Home appreciation.

But homeowners can also incur:

Mortgage interest

Taxes

Insurance

Maintenance

HOA

Closing costs

and:

Selling expenses.

Home values can also decline.


Is rent just throwing money away?

No.

Rent is payment for housing.

Homeowners also have housing expenses that don’t become equity, including mortgage interest, property taxes, insurance, maintenance, and transaction costs.


What is the rent-vs-buy break-even point?

The break-even point is the estimated point in time when cumulative net renting cost and cumulative net buying cost become approximately equal under the assumptions entered.

After that point, one option may begin to show a financial advantage.


Why does the time horizon matter so much?

Buying typically has larger transaction costs at the beginning and potentially at the end.

A short ownership period gives those costs less time to be offset by principal repayment, rent increases, or home-value changes.


Does the calculator include home appreciation?

Yes.

You can enter a positive, zero, or negative annual change in home value.


Does the calculator assume homes always appreciate?

No.

You can enter:

0%

or:

A negative percentage

to model flat or declining home values.


Does the calculator include selling costs?

Yes.

Selling costs can be entered as either:

A dollar amount

or:

A percentage of estimated future home value.


Does it include purchase closing costs?

Yes.

Purchase closing costs can be entered as:

A dollar amount

or:

A percentage of purchase price.

For a detailed breakdown, use:

➡️ Closing Cost Calculator


Does it include PMI?

Yes.

You can enter monthly PMI or other mortgage insurance manually and optionally specify the number of months to include it.


Can maintenance be entered as a percentage?

Yes.

Maintenance can be entered as:

An annual dollar amount

or:

A percentage of home value.


Can taxes, insurance, HOA and maintenance increase over time?

Yes.

The updated calculator allows separate annual growth assumptions for each.


Does the calculator include investment opportunity cost?

Yes, optionally.

You can enter an assumed investment return to model what may happen if the renter invests the buyer’s initial down payment and closing-cost difference, and if either side invests monthly housing savings.


Is the investment result guaranteed?

No.

It is only a mathematical scenario based on the rate entered.

Investment returns are not guaranteed.


Does the calculator include tax deductions?

No.

Mortgage-interest and other tax effects can vary significantly by jurisdiction and individual circumstances.

QuickLoanCalc does not automatically calculate a tax benefit.


Does the calculator support currencies outside the United States?

Yes.

It supports:

  • USD
  • EUR
  • GBP
  • CAD
  • AUD
  • NZD

Changing currency changes display formatting only.

It does not convert values between currencies.


Rent Is a Housing Cost

Ownership Has Housing Costs Too

That’s the core of this calculator.

Renters pay:

For housing.

Owners pay:

For housing and ownership.

Part of the owner’s money may create equity.

Part does not.

The renter may keep or invest money that would otherwise have become:

Down payment and ownership expense.

Neither side gets a free home.

The question is:

What does each choice cost — and what does each choice leave you with?


The Winner Can Change

Renting may win:

Today.

Buying may win:

In Year 8.

Or:

Renting may remain ahead for:

The entire period.

That’s why QuickLoanCalc doesn’t tell you:

“Always rent.”

or:

“Always buy.”

It tells you:

What happens under the assumptions you entered.


Don’t Ask Only “Which Is Cheaper This Month?”

Ask:

What will rent cost over the years I expect to stay?

How much will I spend to buy?

How much mortgage interest will I pay?

How much principal will I repay?

What if the home doesn’t appreciate?

What if rent barely increases?

What will selling cost?

How much equity would actually remain after the sale?

When does buying break even?

What if I invest the difference instead?

Those questions produce a much better comparison.


Renting Costs Money. Owning Costs Money.

The Question Is What Each Choice Leaves You With After the Years That Matter to You.

That’s the purpose of the QuickLoanCalc Rent vs. Buy Calculator.

Set your timeline.

Enter realistic numbers.

Change the assumptions.

Find the break-even point.

Then:

Make the decision with the trade in front of you.


Continue Your Home-Buying Analysis

➡️ Mortgage Calculator
Estimate monthly housing cost, mortgage interest, rate sensitivity, and long-term scheduled repayment.

➡️ Home Affordability Calculator
See whether the home may fit your income, existing debt, down payment, and household budget.

➡️ Debt-to-Income Calculator
Compare recurring monthly debt with gross income and estimate projected DTI with a new home.

➡️ Down Payment Calculator
Compare down-payment amounts and see how much of the purchase price remains to finance.

➡️ Closing Cost Calculator
Estimate purchase closing costs, prepaids, deposits, credits, and cash still needed at closing.

➡️ Mortgage Payoff Calculator
See how extra payments and lump sums may shorten a mortgage and reduce interest.

➡️ Refinance Calculator
Compare an existing mortgage with a potential refinance.

➡️ Loan Life Cost Calculator
Convert loan repayment and interest into estimated work hours, workdays, and workweeks.

➡️ Mortgage Calculators & Home Financing Tools
Explore the complete QuickLoanCalc mortgage and home-financing collection.


Explore Real Estate Listings & Property Values

Research homes, commercial properties, market values, and real estate trends using these popular real estate platforms. Use the mortgage calculator above to compare estimated financing costs before making a purchase decision.


Important Information

QuickLoanCalc.net provides calculators and educational information for general informational purposes.

Rent-vs-buy calculations are estimates based on the values and assumptions entered by the user.

Actual renting and homeownership results can vary because of:

  • Rent changes
  • Home prices
  • Property-value changes
  • Mortgage rates
  • Loan terms
  • Property taxes
  • Homeowners insurance
  • HOA dues
  • Mortgage insurance
  • Maintenance
  • Repairs
  • Closing costs
  • Selling expenses
  • Local fees
  • Investment returns
  • Market conditions
  • Timing

Estimated home appreciation is not a prediction or guarantee.

Home values may rise, remain flat, or fall.

Estimated investment returns are hypothetical scenario assumptions and are not guaranteed.

The investment comparison does not automatically include investment taxes, fees, volatility, contribution limits, or differences in investment risk.

The calculator does not automatically include mortgage-interest tax deductions, property-tax deductions, capital-gains taxes, tax credits, rent deposits, utilities, moving expenses, major renovations, special assessments, or every possible ownership or rental expense.

Mortgage-insurance rules vary by loan product, lender, loan-to-value ratio, and other circumstances. Enter PMI or mortgage-insurance assumptions manually when applicable.

Estimated selling costs are planning assumptions and may differ substantially from actual costs.

Estimated net home equity is calculated from the modeled home value, remaining mortgage balance, and entered selling costs. It is not an appraisal, guaranteed sale price, or guaranteed amount the homeowner would receive.

The calculated break-even point depends entirely on the assumptions entered and can change when rent, appreciation, mortgage rate, ownership costs, or the time horizon changes.

Currency selection changes number formatting only and does not perform currency conversion. Use one currency consistently for all entered values.

QuickLoanCalc.net is not a lender, mortgage broker, real-estate agent, appraiser, financial advisor, accountant, attorney, tax advisor, investment advisor, or insurance provider.

Always verify actual rental costs, mortgage terms, taxes, insurance, closing costs, property condition, and other relevant information before making a housing decision.

Last reviewed: September 2026